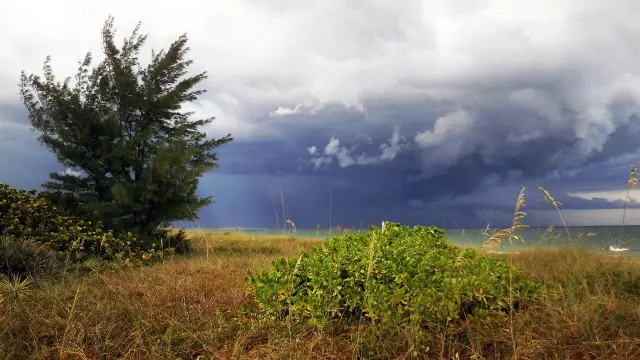
Short answer: St. Petersburg is warm and wet: the official NWS St. Petersburg Area station has an annual normal of 74.7 degrees and 46.65 inches of rain, though 2025 came in 4.10 inches dry. NWS Tampa Bay dates the rainy season May 25 to October 10 for West Central Florida outside its Southwest Florida zone, hurricane season runs June 1 to November 30, and Pinellas County evacuates by storm surge zone. The 1921 hurricane and Milton in 2024 stand out in NWS and NHC records.
Last verified: October 18, 2026, against the sources listed at the end of this page.
What is the climate of St. Petersburg, by the official numbers?
St. Petersburg has a warm, wet climate: the official St. Petersburg Area station has an annual normal temperature of 74.7 degrees and annual normal rainfall of 46.65 inches, with records going back to August 1914.
Those normals come from the year-end climate summary that the National Weather Service Tampa Bay Area office dated January 14, 2026 (NWS Tampa Bay, 2025 climate summary). Across the bay, the Tampa Area station runs slightly cooler and wetter on paper, with a 74.5 degree annual normal and 49.48 inches of rain, and its record starts earlier, in April 1890. By those normals the St. Petersburg Area station runs 0.2 degrees warmer and 2.83 inches drier than the Tampa Area station in a normal year.
| Station | 2025 average temperature | Annual normal | 2025 rainfall | Annual normal rainfall | Records began |
|---|---|---|---|---|---|
| St. Petersburg Area | 75.2 degrees (18th warmest, tie) | 74.7 degrees | 42.55 inches (30th driest) | 46.65 inches | August 1914 |
| Tampa Area | 75.7 degrees (8th warmest) | 74.5 degrees | 40.86 inches (30th driest) | 49.48 inches | April 1890 |
| Difference, St. Petersburg minus Tampa | 0.5 degrees cooler in 2025 | 0.2 degrees warmer | 1.69 inches wetter in 2025 | 2.83 inches drier | 24 years shorter record |
The St. Petersburg seasonal patterns guide breaks those annual normals down month by month, with the wet and dry seasons and what a St. Pete winter looks like.
How have recent months compared with normal in St. Petersburg?
Recent St. Petersburg months have run warm and dry: 2025 ended 0.5 degrees above normal and 4.10 inches short on rain, and September 2026 came in 0.7 degrees warm with 2.39 inches less rain than normal.
NWS described 2025 across West Central and Southwest Florida as a rather warm year with below normal rainfall for most of the region, and Brooksville reported its driest year since records began in 1892 (NWS Tampa Bay, 2025 climate summary). The St. Petersburg Area finished 2025 with its 18th warmest year (tie) and 30th driest. December 2025 stood out in St. Pete, averaging 69.0 degrees against a 65.1 degree normal, 3.9 degrees above and tied for 11th warmest.
Summer 2026 kept the pattern. August 2026 averaged 84.6 degrees in the St. Petersburg Area against an 83.5 degree normal, tied for 16th warmest (NWS Tampa Bay, August and Summer 2026 summary). September 2026 averaged 83.2 degrees against 82.5, tied for 20th warmest, and brought 4.27 inches of rain against a 6.66 inch normal, the 25th driest September in the St. Petersburg Area record (NWS Tampa Bay, September 2026 summary).
A practical reading for St. Petersburg yards and lawns: a station that normally collects 46.65 inches a year came up 4.10 inches short in 2025 and then ran a dry September inside the NWS rainy season window. NWS Tampa Bay dated the August summary September 10 and the September summary October 14, and its October 2026 summary will show whether the end of the rainy season closed the gap.
When is the rainy season in St. Petersburg?
NWS Tampa Bay, whose official climate sites include the St. Petersburg Area station, sets the rainy season at May 15 to October 15 for Southwest Florida and May 25 to October 10 for the rest of West Central Florida.
The office, based in Ruskin, evaluated local thunderstorm science and climatology to define the season for West Central and Southwest Florida, and it says the season usually has three phases (NWS Tampa Bay, Florida Thunderstorm Season). Late May through June is when severe storms are most likely across the region, with hail, damaging winds and waterspouts common along with heavy rain and frequent lightning. July through early September is the peak, when severe weather eases but heavy rain and seasonal river flooding remain the main hazards. Mid September through early October is the wind down phase, when rainfall swings more from year to year because of tropical systems and early fall cold fronts.
The office also explains why the daily storm pattern shifts: the position and strength of the Bermuda High decide where and when thunderstorms favor forming on a given day, which is why the place and time storms favor over St. Petersburg change from one day to the next during the season (NWS Tampa Bay). That three-phase calendar puts the September 2026 shortfall in St. Petersburg across the end of the peak and the start of the wind down phase.
When is hurricane season in St. Petersburg, and how does a household know whether to leave?
The Atlantic season that reaches St. Petersburg lasts from June 1 to November 30 with its peak on September 10, and a household leaves only if an order names its Pinellas County evacuation zone, which is drawn from storm surge risk.
Using the 1991 to 2020 climate period, the National Hurricane Center puts a typical Atlantic year at 14 named storms, of which 7 become hurricanes and 3 major hurricanes, and places most activity from mid August to mid October (National Hurricane Center climatology). For Tampa Bay that window covers the peak of the rainy season and the start of the fall cold front season described above.
Pinellas County puts the rule plainly: a household must know its zone to know whether an evacuation order covers it, and everyone in a zone named in the order must leave (Pinellas County, Evacuation). Residents of mobile homes and manufactured homes in Pinellas must always evacuate because of the wind risk, whatever their zone. As its example the county points to Hurricane Idalia in 2023, when the order was mandatory for level A and for mobile homes.
The City of St. Petersburg hurricane center warns that much of St. Pete lies in evacuation zones and sends residents to the Prepare, St. Pete interactive map to check a zone and flood risk, to Alert Pinellas for emergency notifications, and to the Pinellas County Hurricane Guide (City of St. Petersburg, Hurricane Center). The city line is 727-893-7111, and during emergencies only, Pinellas County takes hurricane information calls at 727-464-4333.
Sandbags are a city service in St. Petersburg year-round: residents may take up to 10 per household with proof of residence, from the Pavement and Traffic Operations Building at 1744 9th Ave. N., which hands them out from 7 a.m. to 3:30 p.m. on weekdays plus the month's second Saturday (City of St. Petersburg, Sandbags). Once a tropical storm or hurricane warning is declared, the city opens storm condition sites, including a full-service station with staff at the Lake Maggiore Park shelter area, 3601 Dr. Martin Luther King, Jr. St. S. The St. Petersburg hurricane season guide covers the outlook, evacuation planning and the sandbag sites in more detail.
Which storms hit St. Petersburg hardest?
Two storms stand out in NWS and NHC records for St. Petersburg: the October 25, 1921 hurricane, the most destructive to hit the Tampa Bay Area since 1848, and Hurricane Milton in 2024, whose largest reported rain total, 20.40 inches, fell near the city.
The NWS Tampa Bay office says the 1921 storm pushed a surge of up to 11 feet into coastal areas from Pasco County south, with the highest water in downtown Tampa and Tarpon Springs, and it lists landfall winds of 120 mph, Category 3, and a landfall pressure of 952.25 mb at Tarpon Springs (NWS Tampa Bay, 1921 hurricane). The same page gives a maximum storm surge in Tampa Bay of about 10.5 feet in its summary table, so the office's own figures differ by about half a foot. Its photo record includes the St. Pete Yacht Club, captioned with the note that many coastal homes and businesses were flooded in Pinellas County.
Milton made landfall on Siesta Key at 0030 UTC on October 10, 2024, with maximum sustained winds near 100 kt, category 3 (NHC Tropical Cyclone Report, Hurricane Milton). NHC reports the largest storm total rain in the event, 20.40 inches, at a CoCoRaHS volunteer site near St. Petersburg, and says the rain caused widespread river and urban flooding in the St. Petersburg and Tampa area. High winds ripped the fabric roof off Tropicana Field in St. Petersburg, and rain then fell into the stadium.
The St. Petersburg historical storm impacts guide covers the 1921 hurricane, Helene's surge and Milton's damage and recovery storm by storm.
Which St. Petersburg weather guide answers which question?
Three St. Petersburg weather guides go deeper than this hub: the seasonal patterns guide, the hurricane season guide and the historical storm impacts guide.
| Question | Key fact, checked October 18, 2026 | Where it is covered |
|---|---|---|
| What are normal St. Pete temperatures and rain? | Annual normal 74.7 degrees and 46.65 inches | St. Petersburg seasonal patterns guide |
| When is the rainy season? | May 25 to October 10 for the rest of West Central Florida; May 15 to October 15 for Southwest Florida | St. Petersburg seasonal patterns guide |
| When is hurricane season? | June 1 to November 30, peak September 10 | St. Petersburg hurricane season guide |
| Must a household evacuate? | Depends on the Pinellas zone; mobile homes always leave | St. Petersburg hurricane season guide |
| What did the 1921 hurricane and Milton do? | Surge up to 11 feet in 1921; 20.40 inches near St. Petersburg in Milton | St. Petersburg historical storm impacts guide |
| How did 2025 and September 2026 compare? | 2025 was 4.10 inches dry; September 2026 was 2.39 inches dry | This hub |
Last verified: October 18, 2026, from the NWS Tampa Bay Area climate summaries for 2025, August 2026 and September 2026, the National Hurricane Center, the City of St. Petersburg Hurricane Center and Pinellas County Emergency Management. The September 2026 summary is dated October 14 and the 2025 summary January 14, so the figures on this page move with each new release (NWS Tampa Bay).
Frequently asked questions
How much rain does St. Petersburg get in a year?
The St. Petersburg Area station has an annual normal of 46.65 inches of rain, according to NWS Tampa Bay. In 2025 it recorded 42.55 inches, 4.10 inches below normal and its 30th driest year in a record that began in August 1914.
What is the average temperature in St. Petersburg?
The St. Petersburg Area annual normal temperature is 74.7 degrees, per the NWS Tampa Bay 2025 summary. The 2025 average was 75.2 degrees, 0.5 degrees above normal, which tied for the 18th warmest year at the St. Petersburg station.
When does the rainy season start in St. Petersburg?
NWS Tampa Bay dates the rainy season from May 25 to October 10 for the rest of West Central Florida and May 15 to October 15 for Southwest Florida. Late May through June brings the most severe storms, and July through early September is the peak of the rainy season.
Does all of St. Petersburg have to evacuate for a hurricane?
No. Pinellas County orders evacuations by zone, based on storm surge risk, and only the zones named in an order must leave. Mobile and manufactured home residents must always evacuate. The St. Pete hurricane center notes that much of the city lies in evacuation zones.
What was the worst hurricane in St. Petersburg history?
For NWS Tampa Bay, no storm since 1848 did more damage to the Tampa Bay Area than the hurricane of October 25, 1921, whose surge reached up to 11 feet; the same page's table gives about 10.5 feet for Tampa Bay. In 2024, Hurricane Milton dropped 20.40 inches near St. Petersburg and tore the Tropicana Field roof.
Sources
- December 2025 and Year 2025 Climate Summary, NWS Tampa Bay Area (dated 01/14/2026) https://www.weather.gov/media/tbw/climate/summaries/Dec_Year2025_final.pdf Used for: 2025 St. Petersburg Area and Tampa Area annual temperature and rainfall with normals, ranks and record start dates; December 2025 temperature
- September 2026 Climate Summary, NWS Tampa Bay Area (dated 10/14/2026) https://www.weather.gov/media/tbw/climate/summaries/Sep2026_final.pdf Used for: September 2026 St. Petersburg Area temperature and rainfall versus normal
- August and Summer 2026 Climate Summary, NWS Tampa Bay Area https://www.weather.gov/media/tbw/climate/summaries/Aug_Summer2026_final.pdf Used for: August 2026 St. Petersburg Area average temperature versus normal and rank
- Florida Thunderstorm Season, NWS Tampa Bay Area https://www.weather.gov/tbw/RainySeason Used for: rainy season dates for West Central and Southwest Florida, three phases
- Tropical Cyclone Climatology, National Hurricane Center https://www.nhc.noaa.gov/climo/ Used for: Atlantic season dates, September 10 peak, 1991 to 2020 average season counts
- Hurricane Center, City of St. Petersburg https://www.stpete.org/residents/public_safety/hurricane_center.php Used for: evacuation zone warning, emergency phone lines, Alert Pinellas, Prepare St. Pete map
- Evacuation, Pinellas County https://pinellas.gov/evacuation/ Used for: zones based on storm surge, mobile home rule, Idalia 2023 level A order
- Tampa Bay / Tarpon Springs Hurricane of 1921, NWS Tampa Bay Area https://www.weather.gov/tbw/hurricane1921 Used for: October 25, 1921 date, surge figures, landfall winds and pressure, rainfall
- Sandbags, City of St. Petersburg https://www.stpete.org/residents/public_safety/sandbags.php Used for: 10 per household limit, proof of residence, year-round location and hours, storm condition sites
- Tropical Cyclone Report, Hurricane Milton, National Hurricane Center https://www.nhc.noaa.gov/data/tcr/AL142024_Milton.pdf Used for: Siesta Key landfall, rainfall near St. Petersburg, Tropicana Field roof
How this page was made
Digital Towns uses AI assistance to research and write its guides, and every page is only as good as the sources it cites. Our goal is the most accurate, useful local information possible.
This page was fact-checked twice before publishing.
If you see an error, or anything you can show is false, tell us right away and we will take a third look.
Report an error
Thank you. We'll take a third look and correct the page if it's wrong.