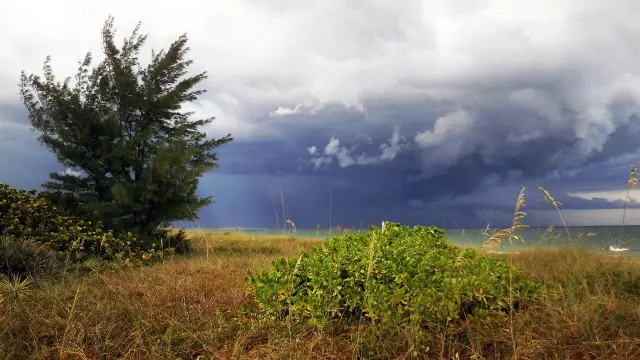
Short answer: Tampa has a wet season and a dry season rather than four seasons: June through September bring 30.24 of the 49.48 inches of normal yearly rain at Tampa International Airport, while October through May average 1.40 to 2.65 inches a month. Highs reach about 91 degrees in July and August and drop to 71.3 in January, by the 1991 to 2020 normals. In 2026 a drought has kept Tampa on once a week watering.
Last verified: October 15, 2026, against the sources listed at the end of this page.
How much of Tampa's yearly rain falls in the wet season?
About 61 percent: Tampa International Airport averages 30.24 of its 49.48 inches of yearly rain from June through September, under the 1991 to 2020 normals (Florida Climate Center, Tampa normals).
The switch between the two Tampa seasons happens in a single month. May averages 2.60 inches at the airport, then June jumps to 7.37 inches, July to 7.75 and August to 9.03, the wettest month of the Tampa year (Florida Climate Center). September still brings 6.09 inches before October falls back to 2.34, and November is the driest month at 1.40 inches. The eight months from October through May add up to 19.24 inches, less than the four summer months combined.
| Month | Average high (F) | Average low (F) | Normal rainfall (inches) |
|---|---|---|---|
| January | 71.3 | 52.8 | 2.65 |
| February | 74.0 | 55.5 | 2.62 |
| March | 77.8 | 59.3 | 2.52 |
| April | 83.0 | 64.8 | 2.55 |
| May | 88.3 | 70.6 | 2.60 |
| June | 90.5 | 75.4 | 7.37 |
| July | 91.0 | 76.6 | 7.75 |
| August | 91.2 | 76.8 | 9.03 |
| September | 90.2 | 75.3 | 6.09 |
| October | 85.6 | 69.2 | 2.34 |
| November | 78.9 | 60.7 | 1.40 |
| December | 73.9 | 55.9 | 2.56 |
| Year | 83.0 | 66.1 | 49.48 |
The figures come from the climate station at Tampa International Airport in Hillsborough County, cooperative observer number 088788. NOAA's National Centers for Environmental Information recalculates the 30 year normals every ten years (NWS Tampa Bay, 1991 to 2020 normals), so the 1991 to 2020 set stays the Tampa baseline until the next decade's update.
Last verified: October 14, 2026, on the Florida Climate Center, National Weather Service Tampa Bay, National Hurricane Center and City of Tampa websites.
What does a typical Tampa rainy season day look like?
A typical Tampa rainy season day starts muggy, with dew points above 70 and lows in the 70s, climbs into the upper 80s to middle 90s, and turns stormy once the sea breeze sets off thunderstorms (NWS Tampa Bay, Florida Thunderstorm Season).
The Ruskin forecast office that covers Tampa says the season begins when showers and storms become almost daily over the peninsula and late night and morning storms form over the eastern Gulf. The office says it is typically accompanied by an increase in humidity with persistent dew point values above 70 F (NWS Tampa Bay). Where the storms fire on a given afternoon depends on the position of the Bermuda High, and NWS Tampa Bay sorts those positions into eight subtropical ridge wind regimes to forecast Tampa thunderstorms day by day.
Those storms cap the afternoon heat in Tampa. NWS Tampa Bay notes that the most dangerous heat index days across West Central Florida come when the wind blows from the west and thunderstorms fail to form; when storms do develop, they work like natural air conditioning (NWS Tampa Bay, heat index statistics). Tampa International Airport sits close enough to the coast to be routinely influenced by the west coast sea breeze, and posted heat index values are for shade: direct sun can raise the figure by up to 15 degrees.
Tampa's muggiest records fall in August. The highest dew point on record at Tampa is 86 degrees, reached on August 6, 2000, and the longest run of dew points at 75 degrees or higher lasted seven days, August 5 to 11, 2024 (NWS Tampa Bay, dew point statistics). Average highs at Tampa International Airport hold between 90.5 and 91.2 degrees from June through August.
How dry is the Tampa dry season, and why is watering limited in 2026?
From October through May, normal monthly rain at Tampa International Airport stays between 1.40 and 2.65 inches, and a long dry spell has left southwest Hillsborough County in Extreme Drought as of October 9, 2026 (NWS Tampa Bay drought statement, Oct. 9, 2026).
The October 9, 2026 drought statement from NWS Tampa Bay places southwest Hillsborough County in D3, Extreme Drought, northwest and central Hillsborough in D2, Severe Drought, and northeast Hillsborough in D1, Moderate Drought (NWS Tampa Bay). The office calls it the most impactful drought within the NWS Tampa Bay area since 2012, and says it was the first time since the Drought Monitor began in 2000 that all of Florida sat at D1 or worse. The C.W. Bill Young Regional Reservoir held 10.39 billion gallons on October 8, about 67 percent of its 15.5 billion gallon capacity.
That is why Tampa lawns are on a once a week schedule. Tampa has been under a Modified Phase III, Extreme, water shortage since April 3, 2026, after the Southwest Florida Water Management District passed the order on March 24, 2026, limiting irrigation to one day a week by the last digit of the house number and banning watering between 4 a.m. and 8 p.m. on any day (City of Tampa, watering days and hours). The Southwest Florida Water Management District has extended the Modified Phase III shortage through March 31, 2027 (NWS Tampa Bay drought statement). Tampa water use restrictions have been in place and enforced year-round since 1992.
| House number ends in | Watering day |
|---|---|
| 0 or 1 | Monday |
| 2 or 3 | Tuesday |
| 4 or 5 | Wednesday |
| 6 or 7 | Thursday |
| 8 or 9, mixed addresses and no address | Friday |
Relief may come with the cool season. The drought statement cites a Climate Prediction Center outlook giving the October through December period a 40 to 70 percent chance of above normal rainfall, and notes that El Nino winters have historically produced above normal rainfall (NWS Tampa Bay). Summer storms had already lowered the Keetch-Byram Drought Index and cut brush fire activity across West Central Florida by early October 2026.
How mild are Tampa winters compared with its summers?
January, the coolest month in Tampa, averages a high of 71.3 degrees and a low of 52.8 at Tampa International Airport, about 24 degrees below the August low of 76.8 (Florida Climate Center).
Degree days show how lopsided the Tampa year is. The airport station averages 433 heating degree days a year against 3,928 cooling degree days, so cooling demand outweighs heating demand roughly nine to one (Florida Climate Center). January carries the most heating need at 152 degree days, while August peaks at 589 cooling degree days. From May through September, Tampa records no heating degree days at all in the normals.
Winter is also when the air in Tampa turns driest. NWS Tampa Bay records a dew point of 0 degrees at Tampa on December 14, 2010, the lowest in hourly data back to 1948, and a six day stretch of dew points below 40 degrees from February 16 to 21, 1958 (NWS Tampa Bay, dew point statistics). By March the normal low at the airport is back to 59.3 degrees. The Tampa snow and freezes guide covers the coldest mornings, and the Tampa weather hub lists the average dates of the first cool fall nights.
How do hurricane season and the Tampa rainy season overlap?
Almost completely: the Atlantic hurricane season runs June 1 to November 30 and peaks on September 10, inside the months that bring Tampa most of its rain (National Hurricane Center, climatology).
The National Hurricane Center says most Atlantic activity falls between mid August and mid October, which lines up with the wettest stretch at Tampa International Airport, August at 9.03 inches and September at 6.09 (NHC).
The Tampa hurricane season guide explains alerts, shelters and supplies for June through November, and the Tampa historical storm impacts guide tracks what past hurricanes and floods did across Hillsborough County.
Frequently asked questions
What is the rainiest month in Tampa?
August is the rainiest month in Tampa, with a normal of 9.03 inches at Tampa International Airport under the 1991 to 2020 normals. July follows at 7.75 inches and June at 7.37, and those summer months together supply most of the 49.48 inches of yearly rain.
What is the driest month in Tampa?
November is the driest month in Tampa, with a normal of 1.40 inches at Tampa International Airport. Every month from October through May averages 2.65 inches or less, which is why Tampa lawns and wetlands dry out over the winter and spring.
How much does Tampa rain jump when the wet season starts?
Normal rainfall at Tampa International Airport rises from 2.60 inches in May to 7.37 inches in June under the 1991 to 2020 normals. NWS Tampa Bay ties the start of the rainy season to almost daily showers and storms over the peninsula and dew points staying above 70 degrees.
What are the watering rules in Tampa in 2026?
Since April 3, 2026, the City of Tampa has been under a Modified Phase III water shortage: one watering day a week set by the last digit of the house number, and no watering between 4 a.m. and 8 p.m. The district order runs through March 31, 2027.
How hot is a Tampa summer?
Average highs at Tampa International Airport are 90.5 degrees in June, 91.0 in July and 91.2 in August, with lows near 76 to 77 degrees. Afternoon thunderstorms usually cap the heat, and the highest Tampa dew point on record is 86 degrees, set August 6, 2000.
Sources
- Florida Climate Center (FSU), Tampa 1991-2020 normals https://climatecenter.fsu.edu/products-services/data/1991-2020-normals/tampa Used for: monthly normal highs, lows, rainfall and degree days at Tampa International Airport, COOP 088788
- NWS Tampa Bay Area, New 1991-2020 Normals https://www.weather.gov/tbw/newnormals Used for: how and how often NCEI calculates 30-year normals
- NWS Tampa Bay Area, Florida Thunderstorm Season https://www.weather.gov/tbw/RainySeason Used for: rainy season onset signals, Bermuda High wind regimes, wind down phase
- NWS Tampa Bay Area, Heat Index Tools and Statistics https://www.weather.gov/tbw/heatindex Used for: west wind heat pattern, sea breeze at Tampa International Airport, sun adds up to 15 F
- NWS Tampa Bay Area, Dew Point Statistics https://www.weather.gov/tbw/dewpoint Used for: Tampa dew point records: 86 F Aug. 6, 2000; seven days at 75 F or higher Aug. 5-11, 2024; 0 F Dec. 14, 2010; Feb. 16-21, 1958
- NWS Tampa Bay, Drought Information Statement, Oct. 9, 2026 https://www.weather.gov/media/tbw/DGT/DGT_TBW_10092026.txt Used for: Hillsborough drought categories, reservoir level, Phase III extension to March 31, 2027, Oct-Dec outlook
- City of Tampa Water Department, My Allowed Watering Days and Hours https://www.tampa.gov/water/conservation/watering-days-and-hours Used for: Modified Phase III effective April 3, 2026, once a week schedule, hours, restrictions since 1992
- National Hurricane Center, Tropical Cyclone Climatology https://www.nhc.noaa.gov/climo/ Used for: season dates June 1 to Nov. 30, Sept. 10 peak, mid-August to mid-October activity
How this page was made
Digital Towns uses AI assistance to research and write its guides, and every page is only as good as the sources it cites. Our goal is the most accurate, useful local information possible.
This page was fact-checked twice before publishing.
If you see an error, or anything you can show is false, tell us right away and we will take a third look.
Report an error
Thank you. We'll take a third look and correct the page if it's wrong.